Every day, three times per second, we produce the equivalent of the amount of data that the Library of Congress has in its entire print collection, right? But most of it is like cat videos on YouTube or 13-year-olds exchanging text messages about the next Twilight movie.– Nate Silver
Building a Simple Sales Dashboard with QlikView
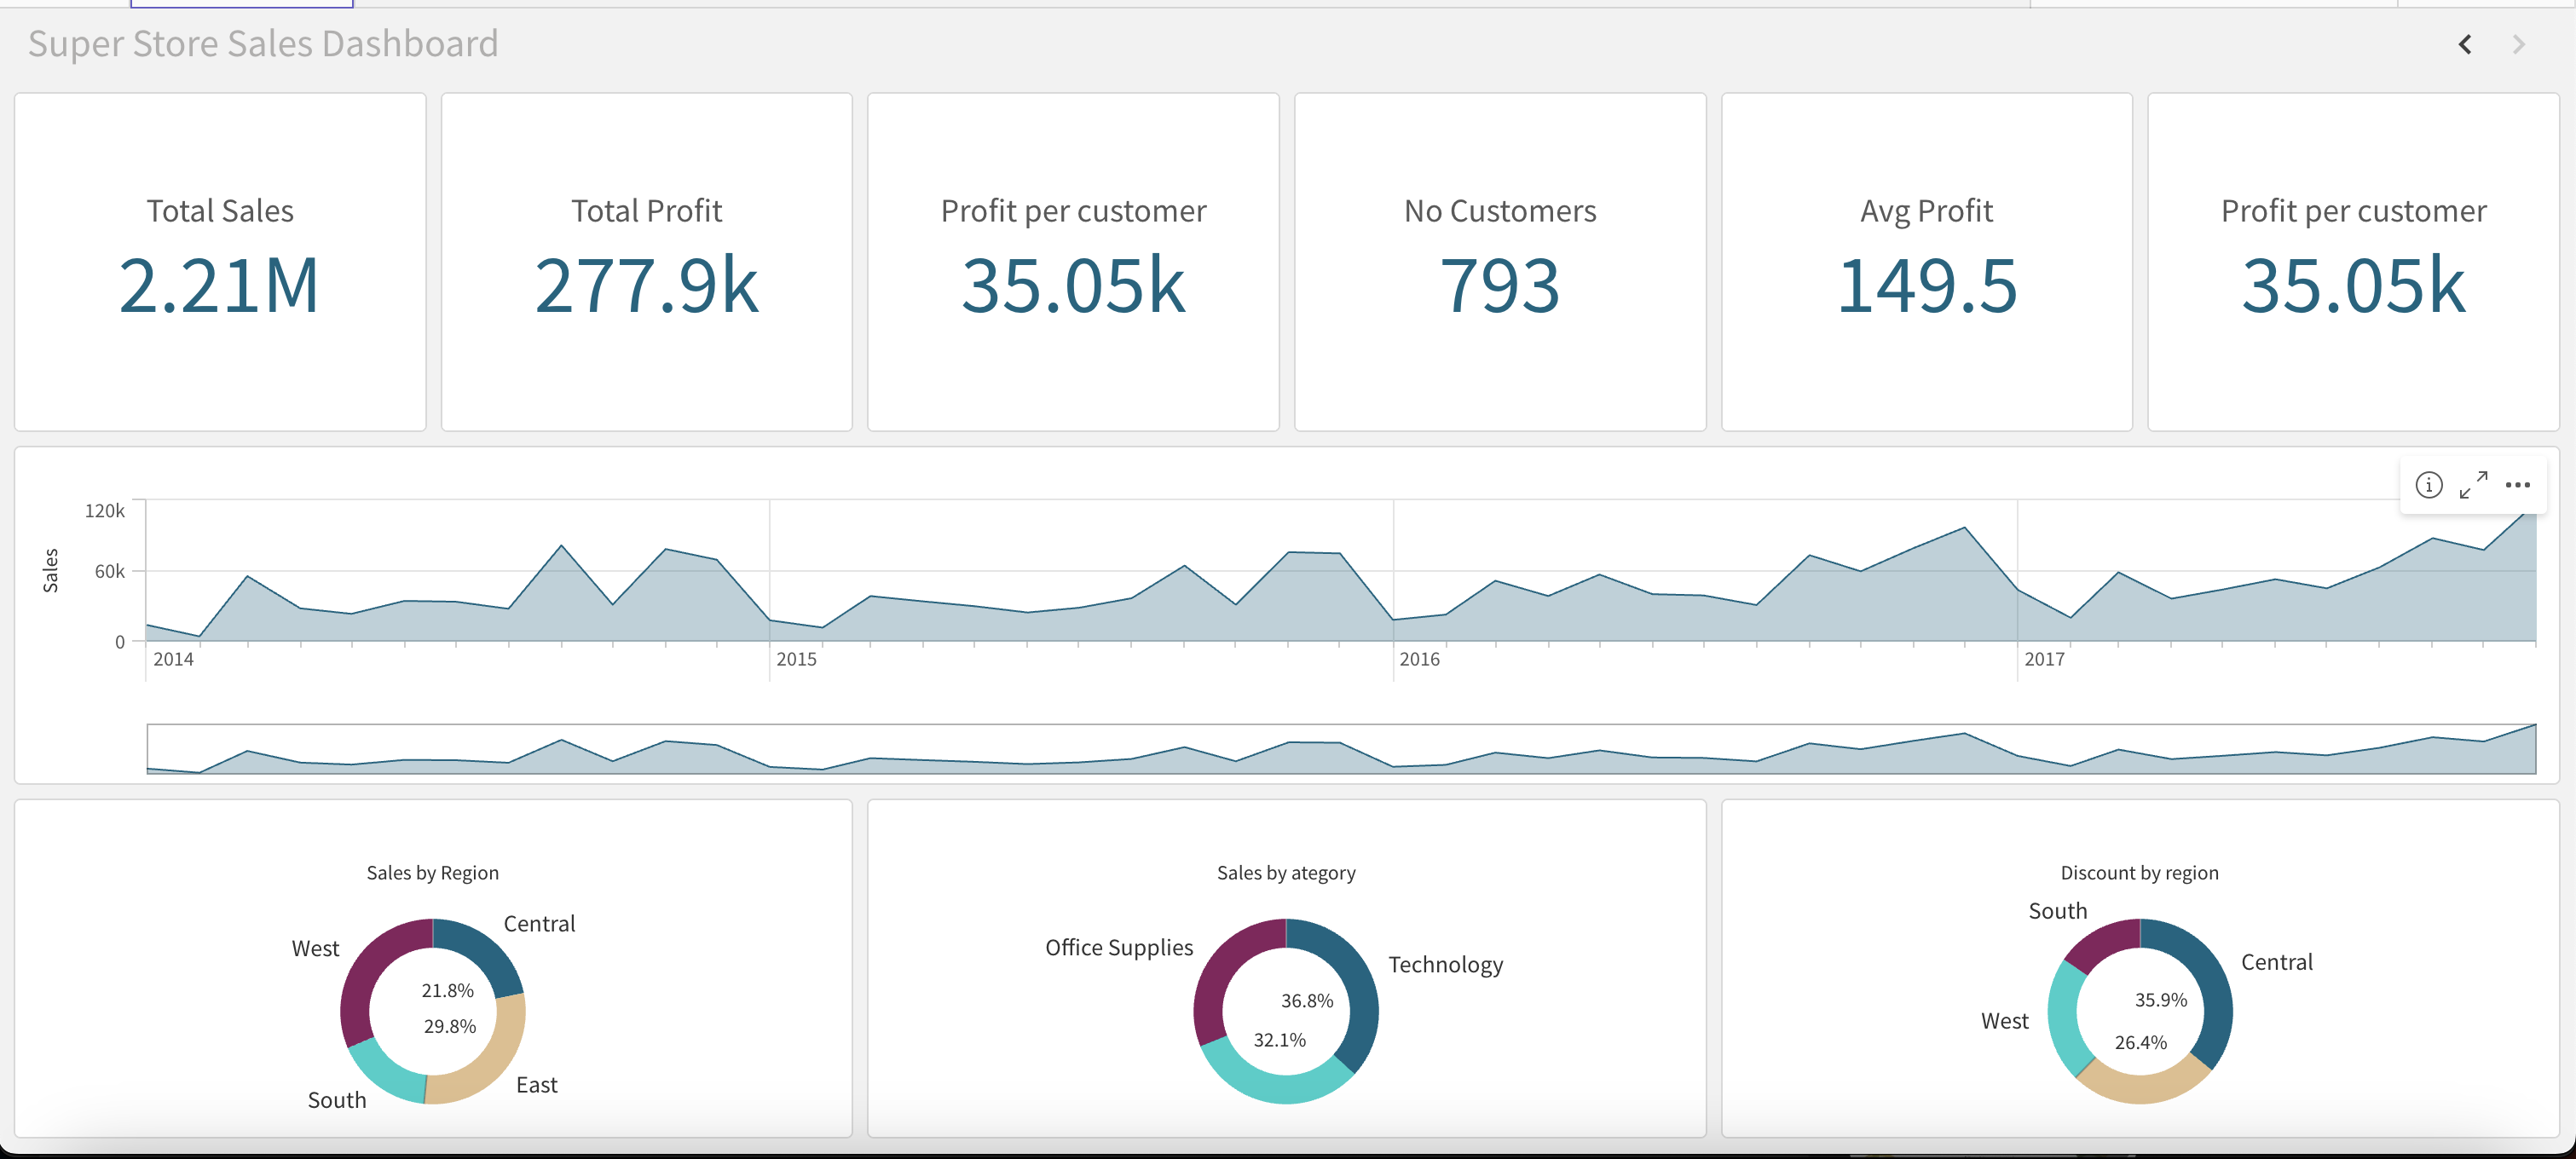
In this blog, I'll walk you through how I built a simple sales dashboard using QlikView. My goal was to create an interactive tool that provides clear and actionable insights into our sales performance. Starting with data collection, I integrated various sources to ensure comprehensive coverage. Using QlikView's data modeling capabilities, I transformed and structured the data to highlight key metrics such as sales trends and performance indicators. I then designed the dashboard layout, incorporating intuitive visualizations and charts for easy interpretation. The result was a user-friendly sales dashboard that enhanced our ability to make data-driven decisions, identify opportunities, and improve overall sales efficiency.
Create a Free Trial Qlik Sense Account
To get started, you need to create a free trial Qlik Sense account. Follow these steps:
- Visit the Qlik Sense website and click on "Free Trial."
- Fill in the required information and submit the form.
- Check your email for the confirmation link and follow the instructions to activate your account.
Creating a Qlik App
Once your account is set up, the next step is to create a new Qlik app:
- Log in to your Qlik Sense account.
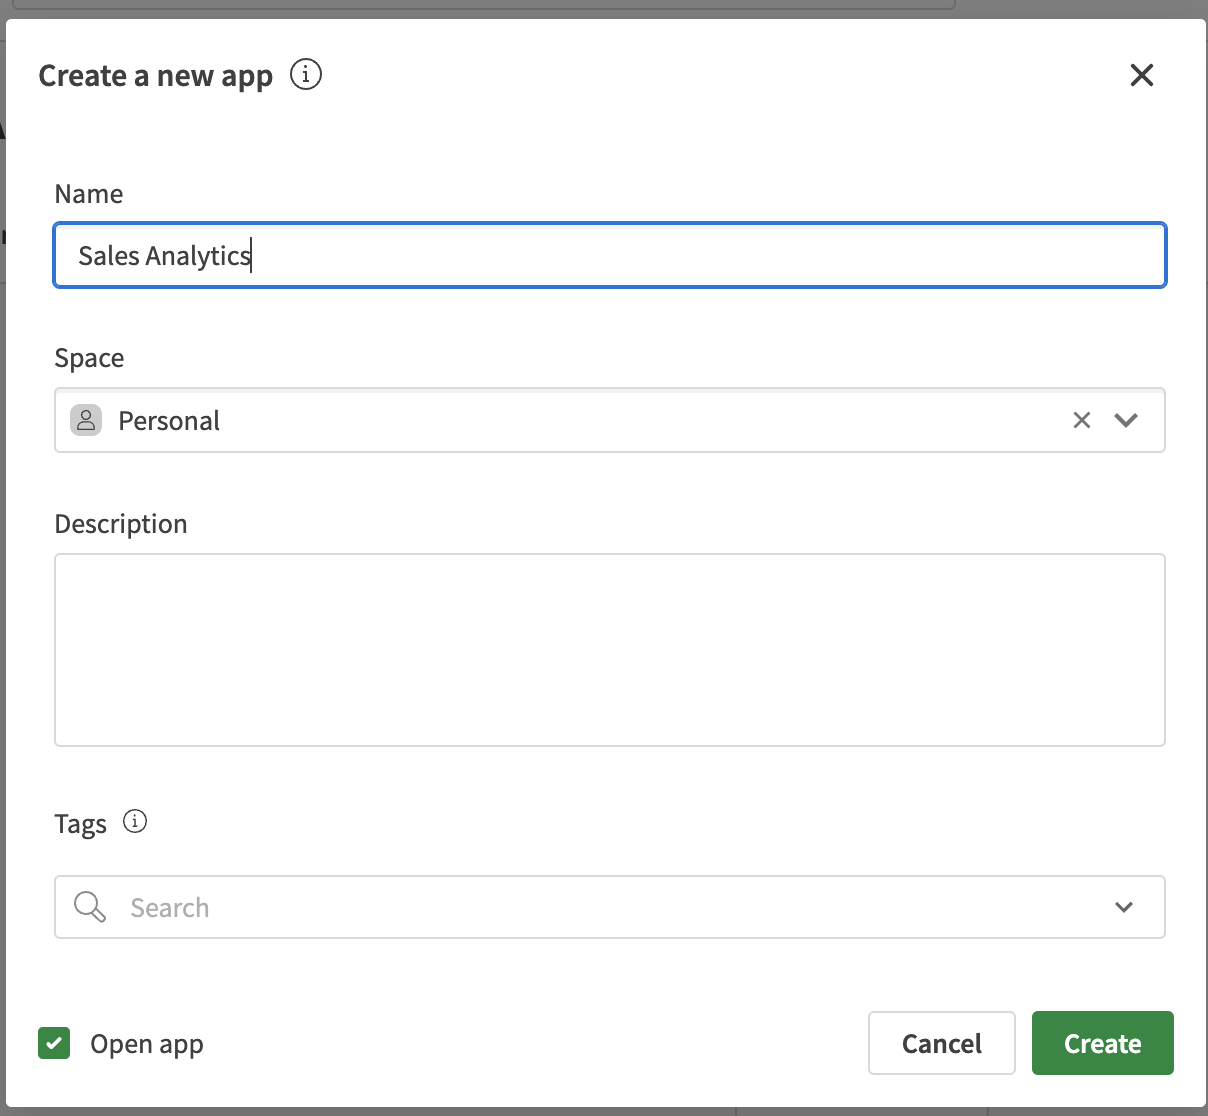
- Click on "Create New App."
- Give your app a name and click "Create."
- Open the app to start building your dashboard.
Loading Data into the Catalog
After creating your app, load your sales data into Qlik Sense's data catalog:
- Open your app and navigate to the "Data Load Editor."
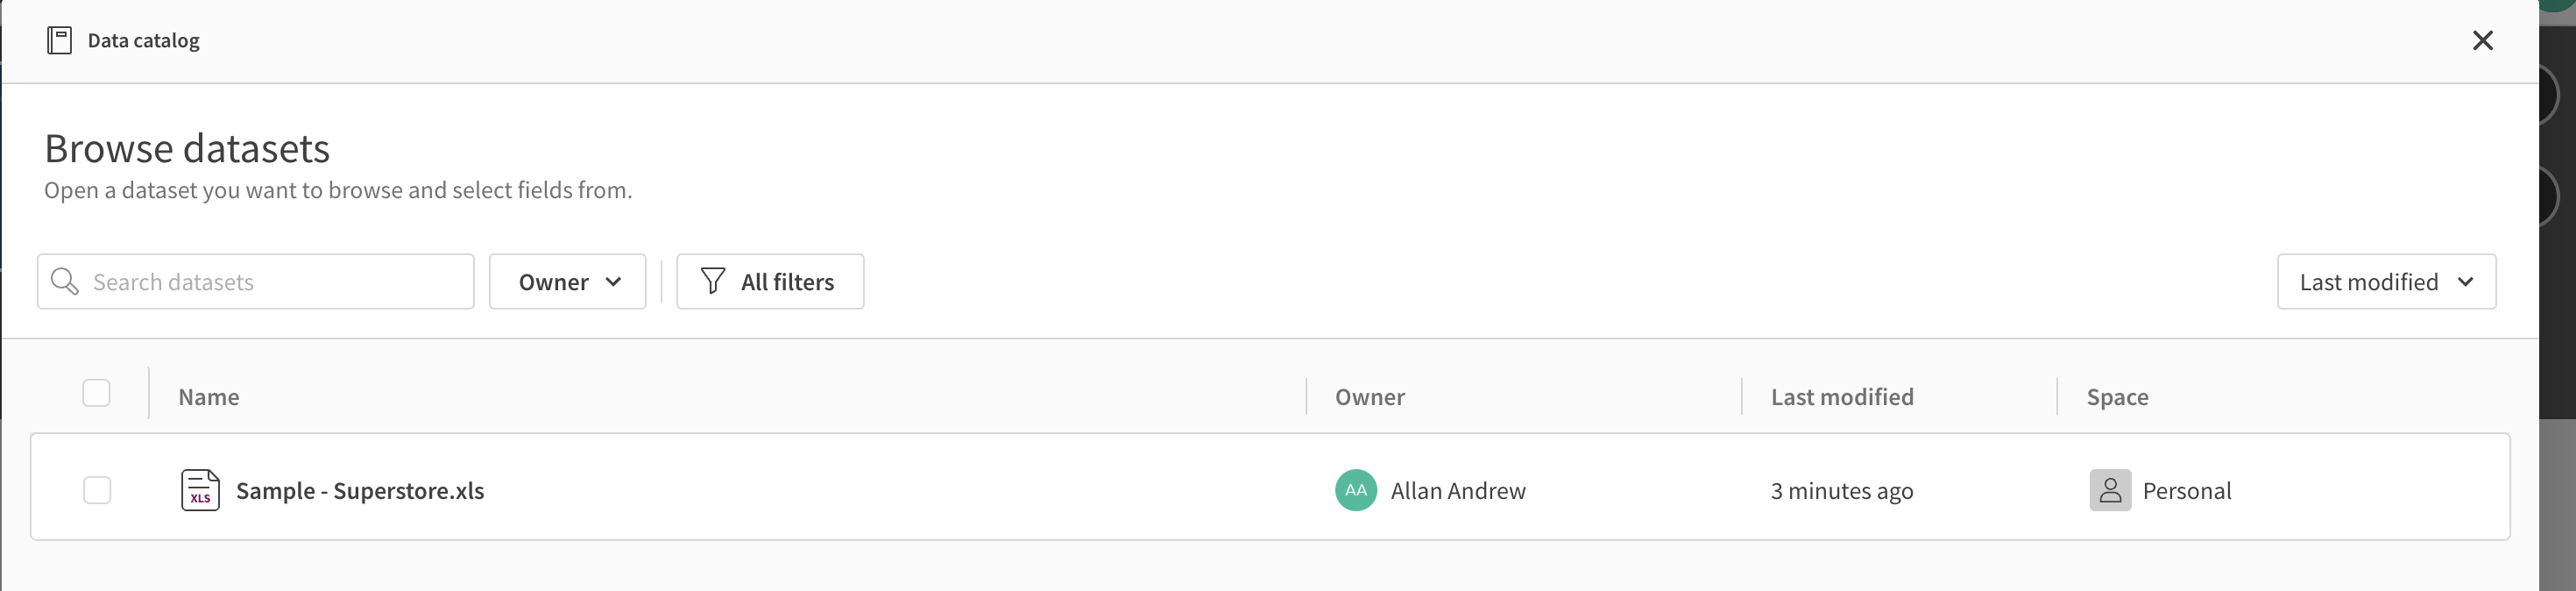
- Click "Add Data" and choose your data sources (e.g., Excel, CSV, databases).
- Follow the prompts to upload and preview your data.
- Load the data into the app.
Creating Measures
With your data loaded, define key measures to analyze your sales performance:
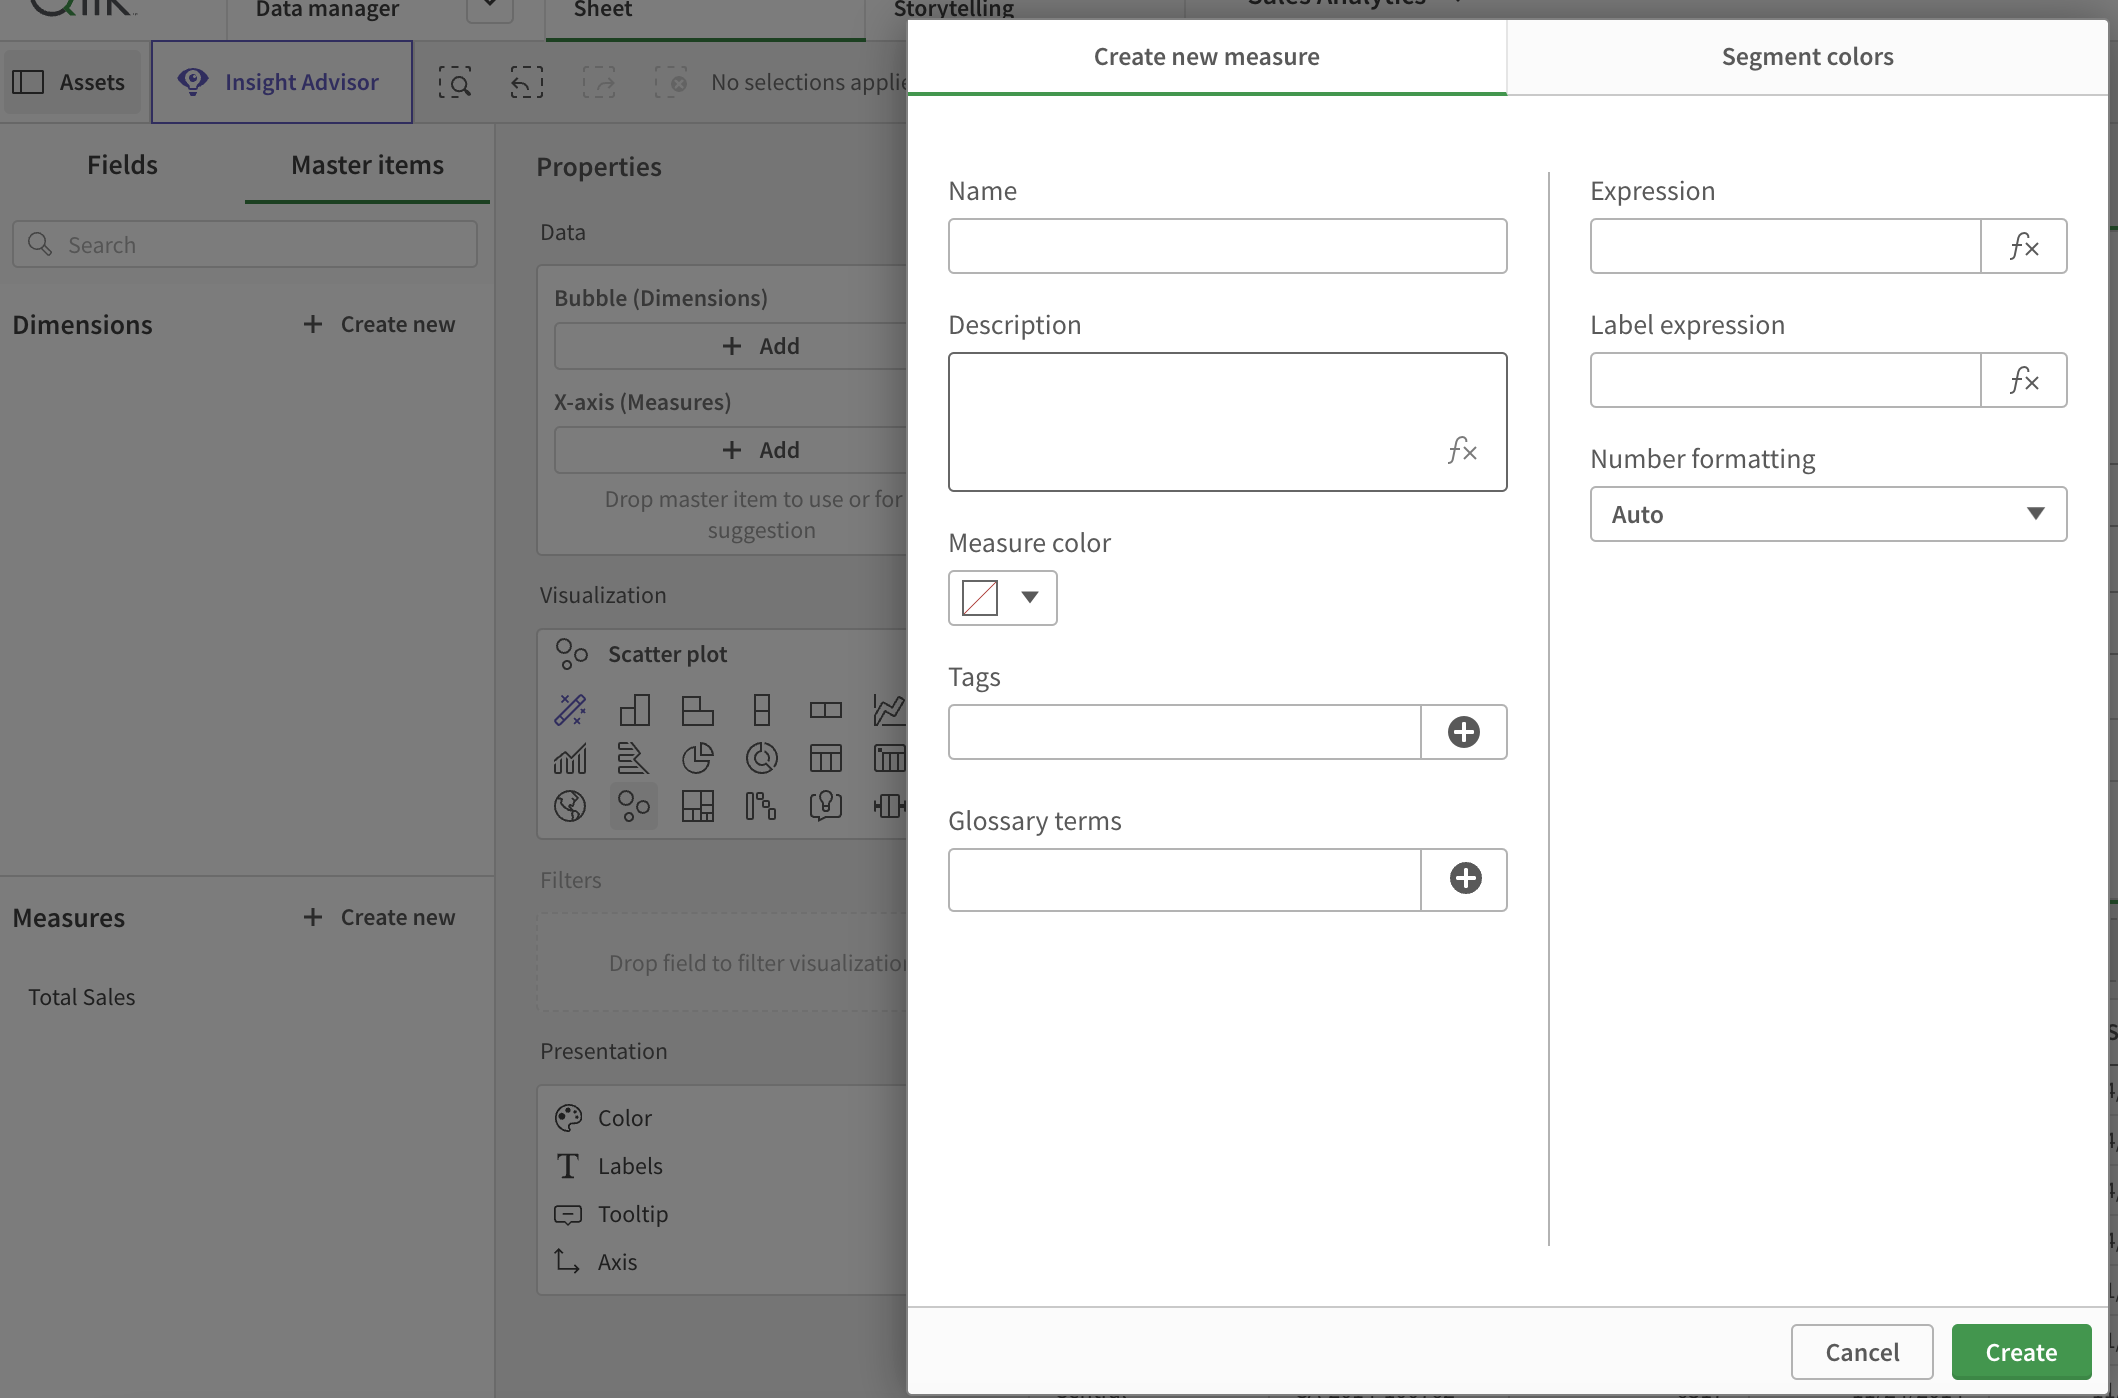
- Go to the "Data Manager" and click on "Create New Measure."
- Define measures such as total sales, average order value, and sales growth.
- Save your measures for use in visualizations.
Creating and Adding Sheets to the Dashboard
Finally, create sheets within your Qlik app to organize your visualizations:
- Navigate to the "App Overview" and click "Create New Sheet."
- Add visualizations to the sheet, such as charts, graphs, and KPIs.
- Arrange the visualizations to tell a compelling story about your sales data.
- Repeat the process to add multiple sheets if necessary.